How to diagram an anatomical region of interest (ROI) on a brain

You might need to eventually create an anatomical illustration highlighting a particular brain region. This figure on the right is from my chapter on Transcortical Sensory Aphasia in the Oxford Handbook of Aphasia. This illustrates specific regions on a cutout using semi-transparent colors with gyri and sulci labeled. I created this figure to highlight the anatomy of the temporoparietal junction (TPJ), a nexus point where many gyri converge. Tbh I always forget where the supramarginal and angular gyri are. For this particular figure, I used the Ch2Better.nii brain template from MRIcron as the base. These illustrations are not too challenging to create. I find them helpful, and they are often quite beautiful. Let’s give this a whirl, shall we?
Before you start, isolate the target structure and determine the best plane to illustrate it in. Let’s say you want to highlight the left inferior frontal gyrus. You might do this on a saggital slice or 3d surface map. In contrast, if you wanted to highlight the hippocampi, you might choose a coronal slice. This tracing technique is best for highlighting coarse macrostructure (e.g., a gyrus). Co-reference a brain atlas when you do the manual tracing. Here are some links to human brain atlases. We will explore two tracing methods. Method 1 will involve manually tracing ROIs on a template brain using Adobe Photoshop. Method 2 will involve highlighting structures using a segmented human brain atlas from Neuromorphemetrics Inc.
Method I: manual tracing on a template brain
step 1: choose a base brain for diagramming
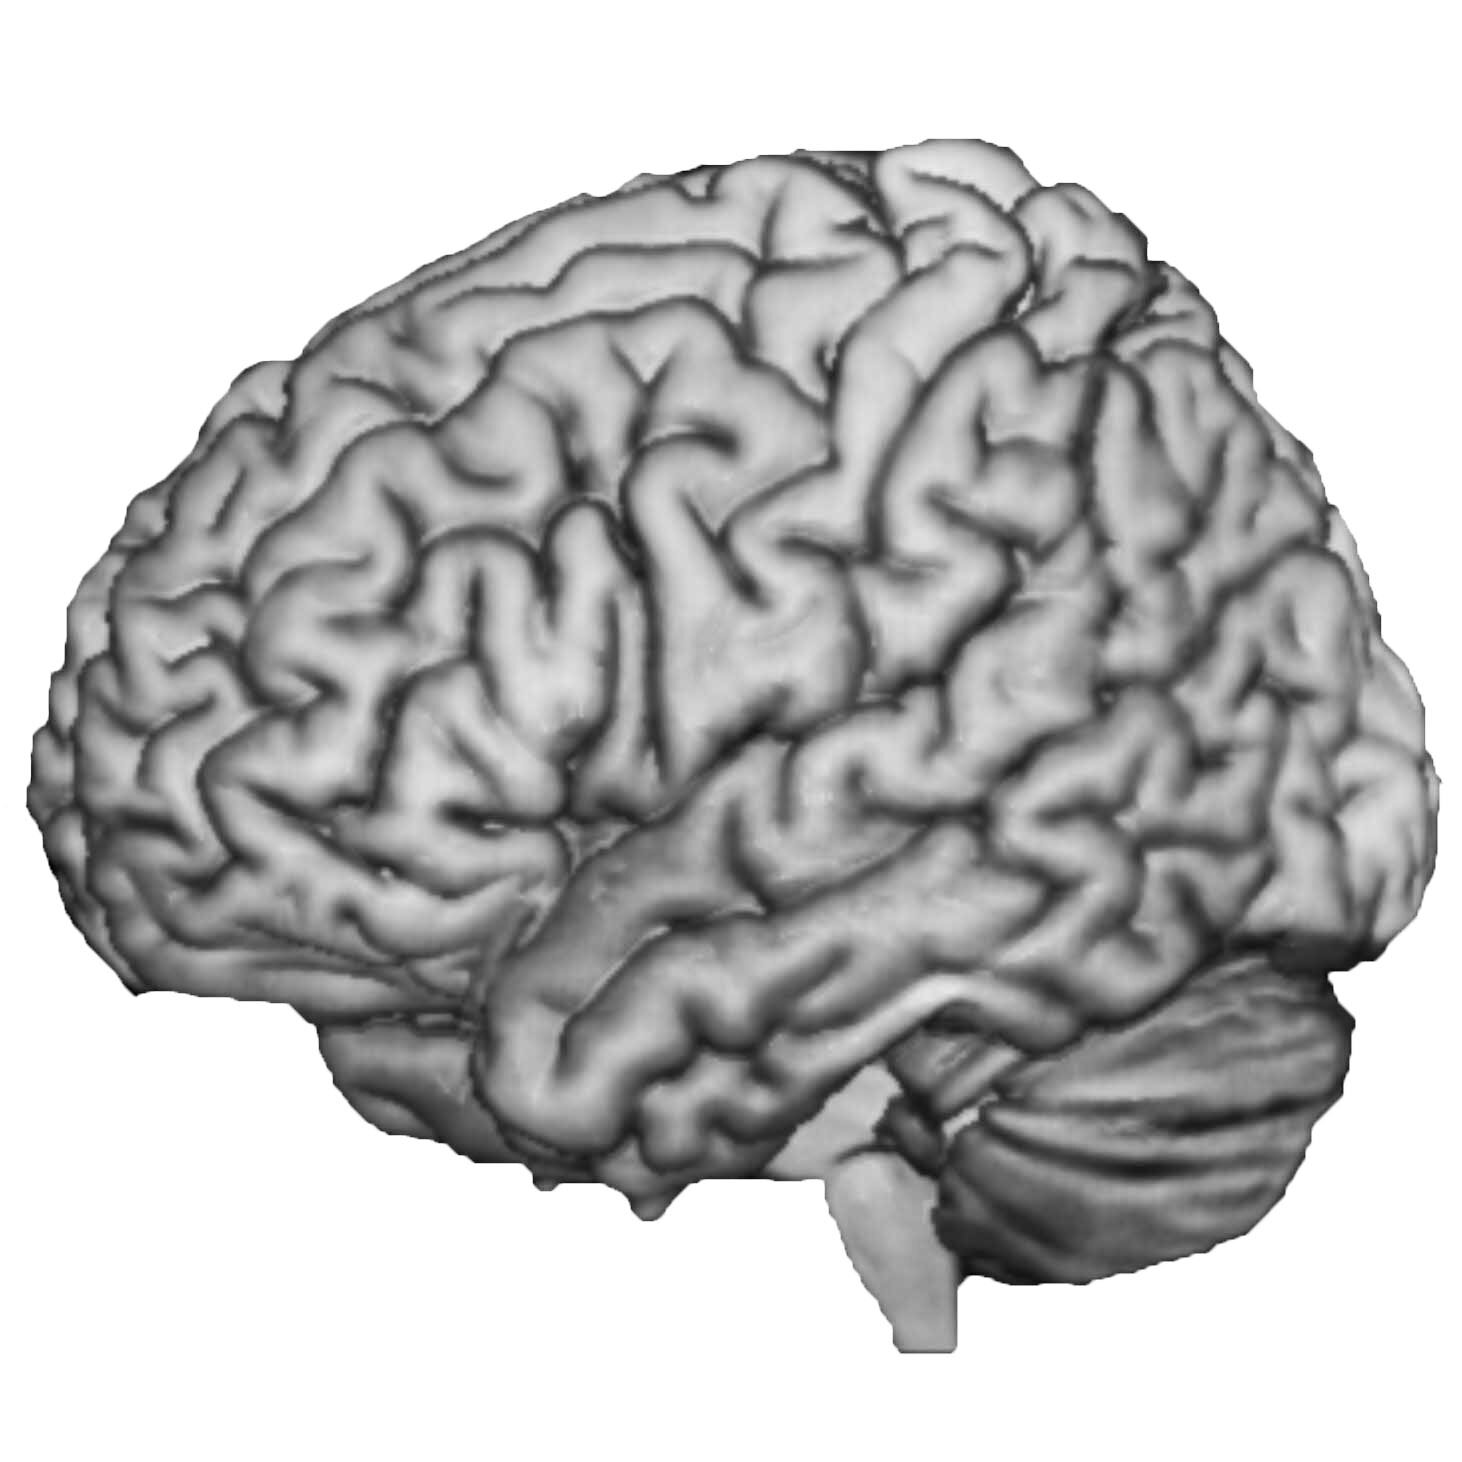
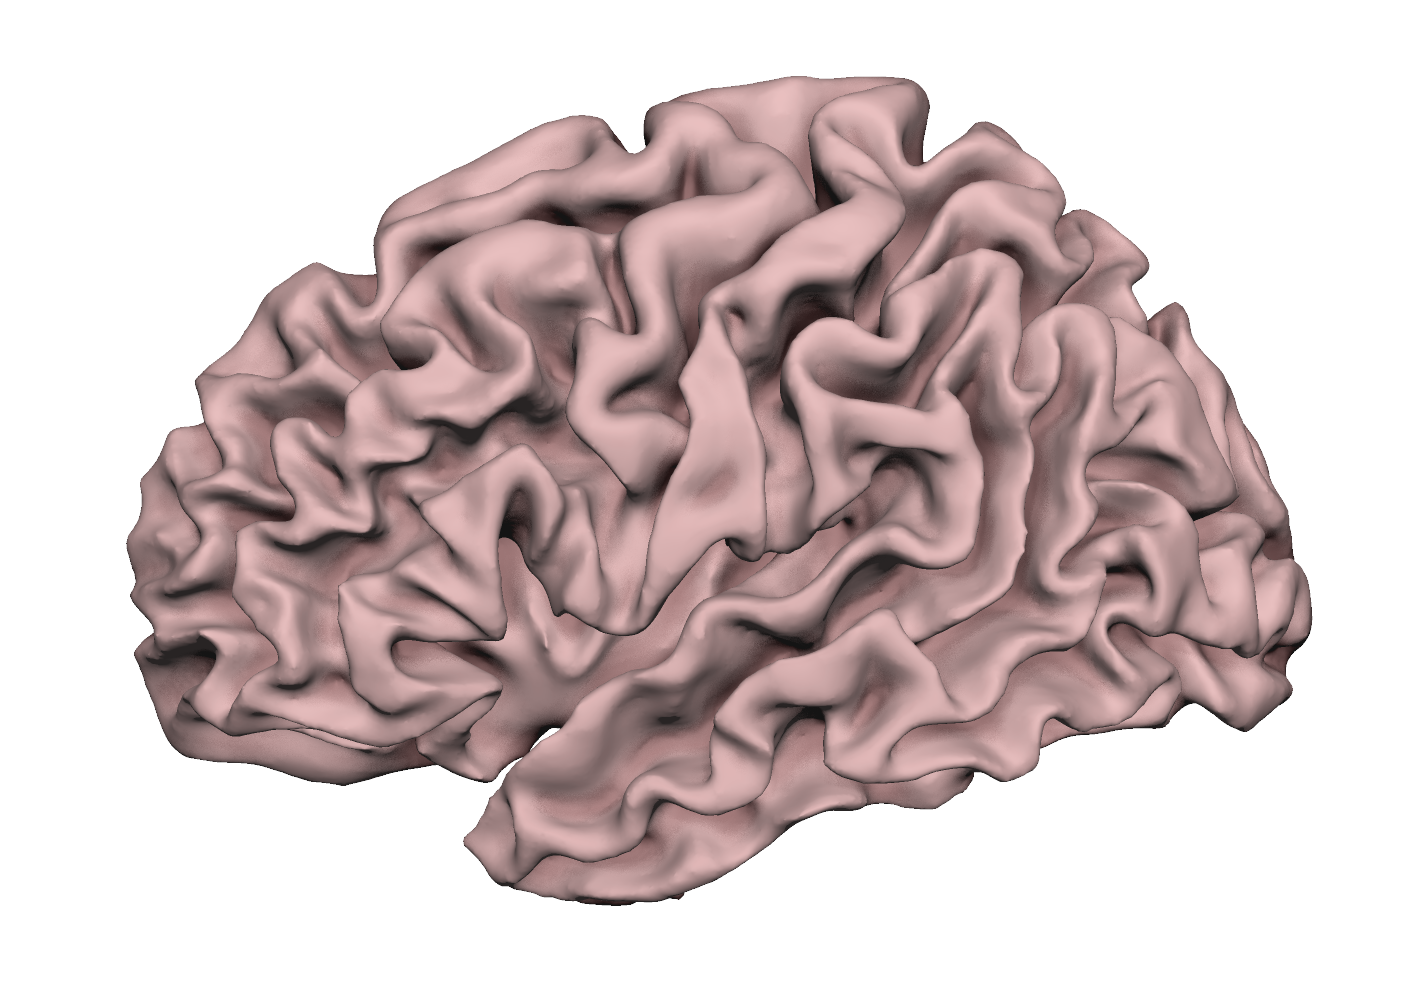
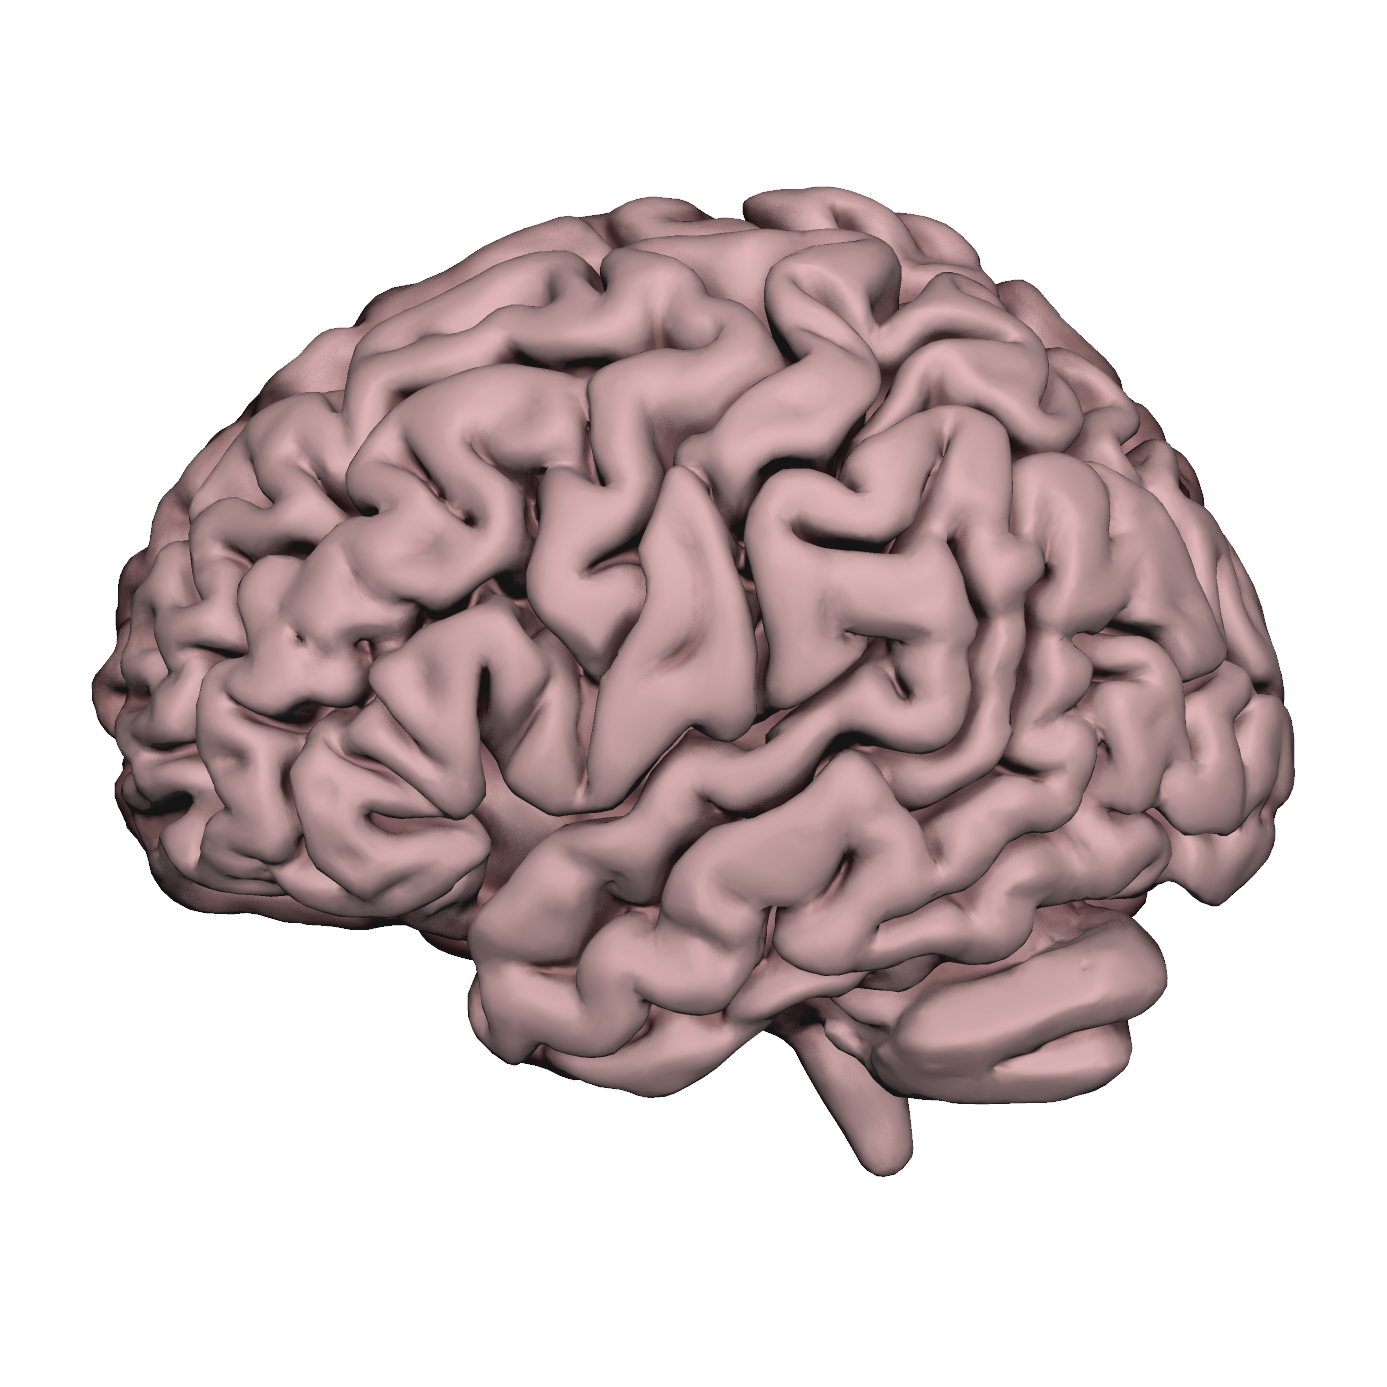
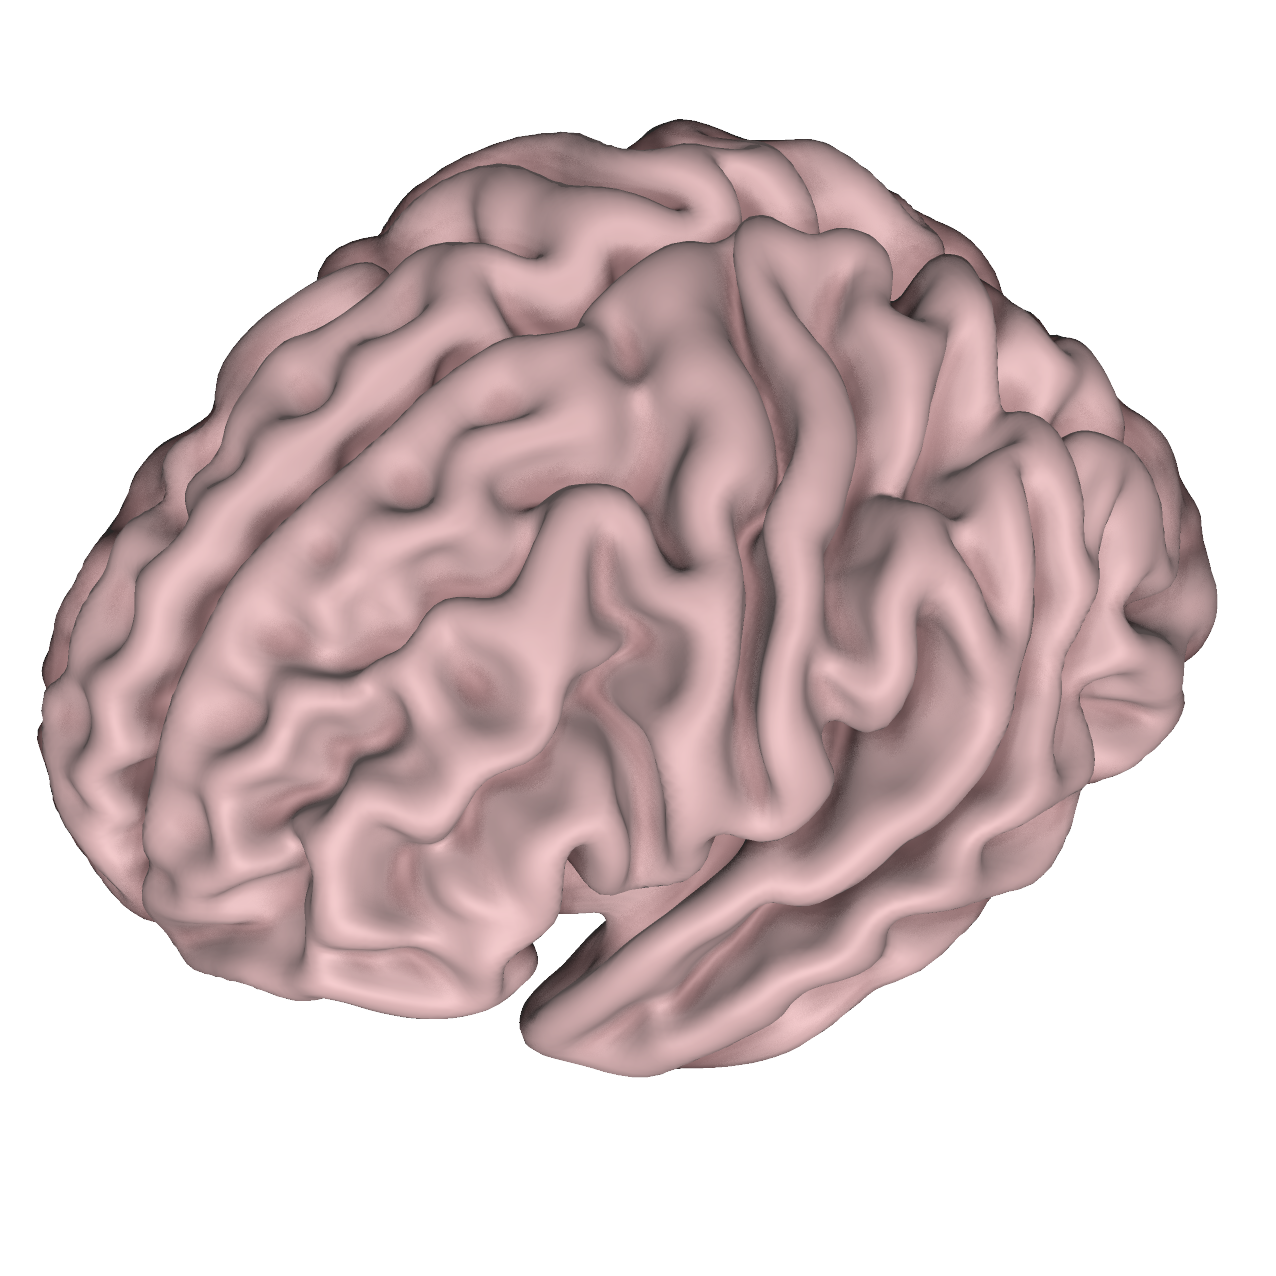
Select a template brain you plan to diagram on. You have many options nested within some of the most popular imaging analysis programs (MRIcron, SPM12, Freesurfer, AFNI, Surfice). Take a look at just a few choices on the figure to the right. When you find a template you like, navigate to the 3d template brain within the program you are working in, then export the slice you are interested in as a 2d flat image. Higher resolution is best (.png lossless if possible, jpeg if not). The images in the slideshow reflect 2d views exported from several different 3d templates all within Professor Chris Rorden’s Surfice software. I changed the background to white. It’s a personal preference whether you want to illustrate an inflated brain or something that looks more lifelike.
Steps 2-15: follow this sequence
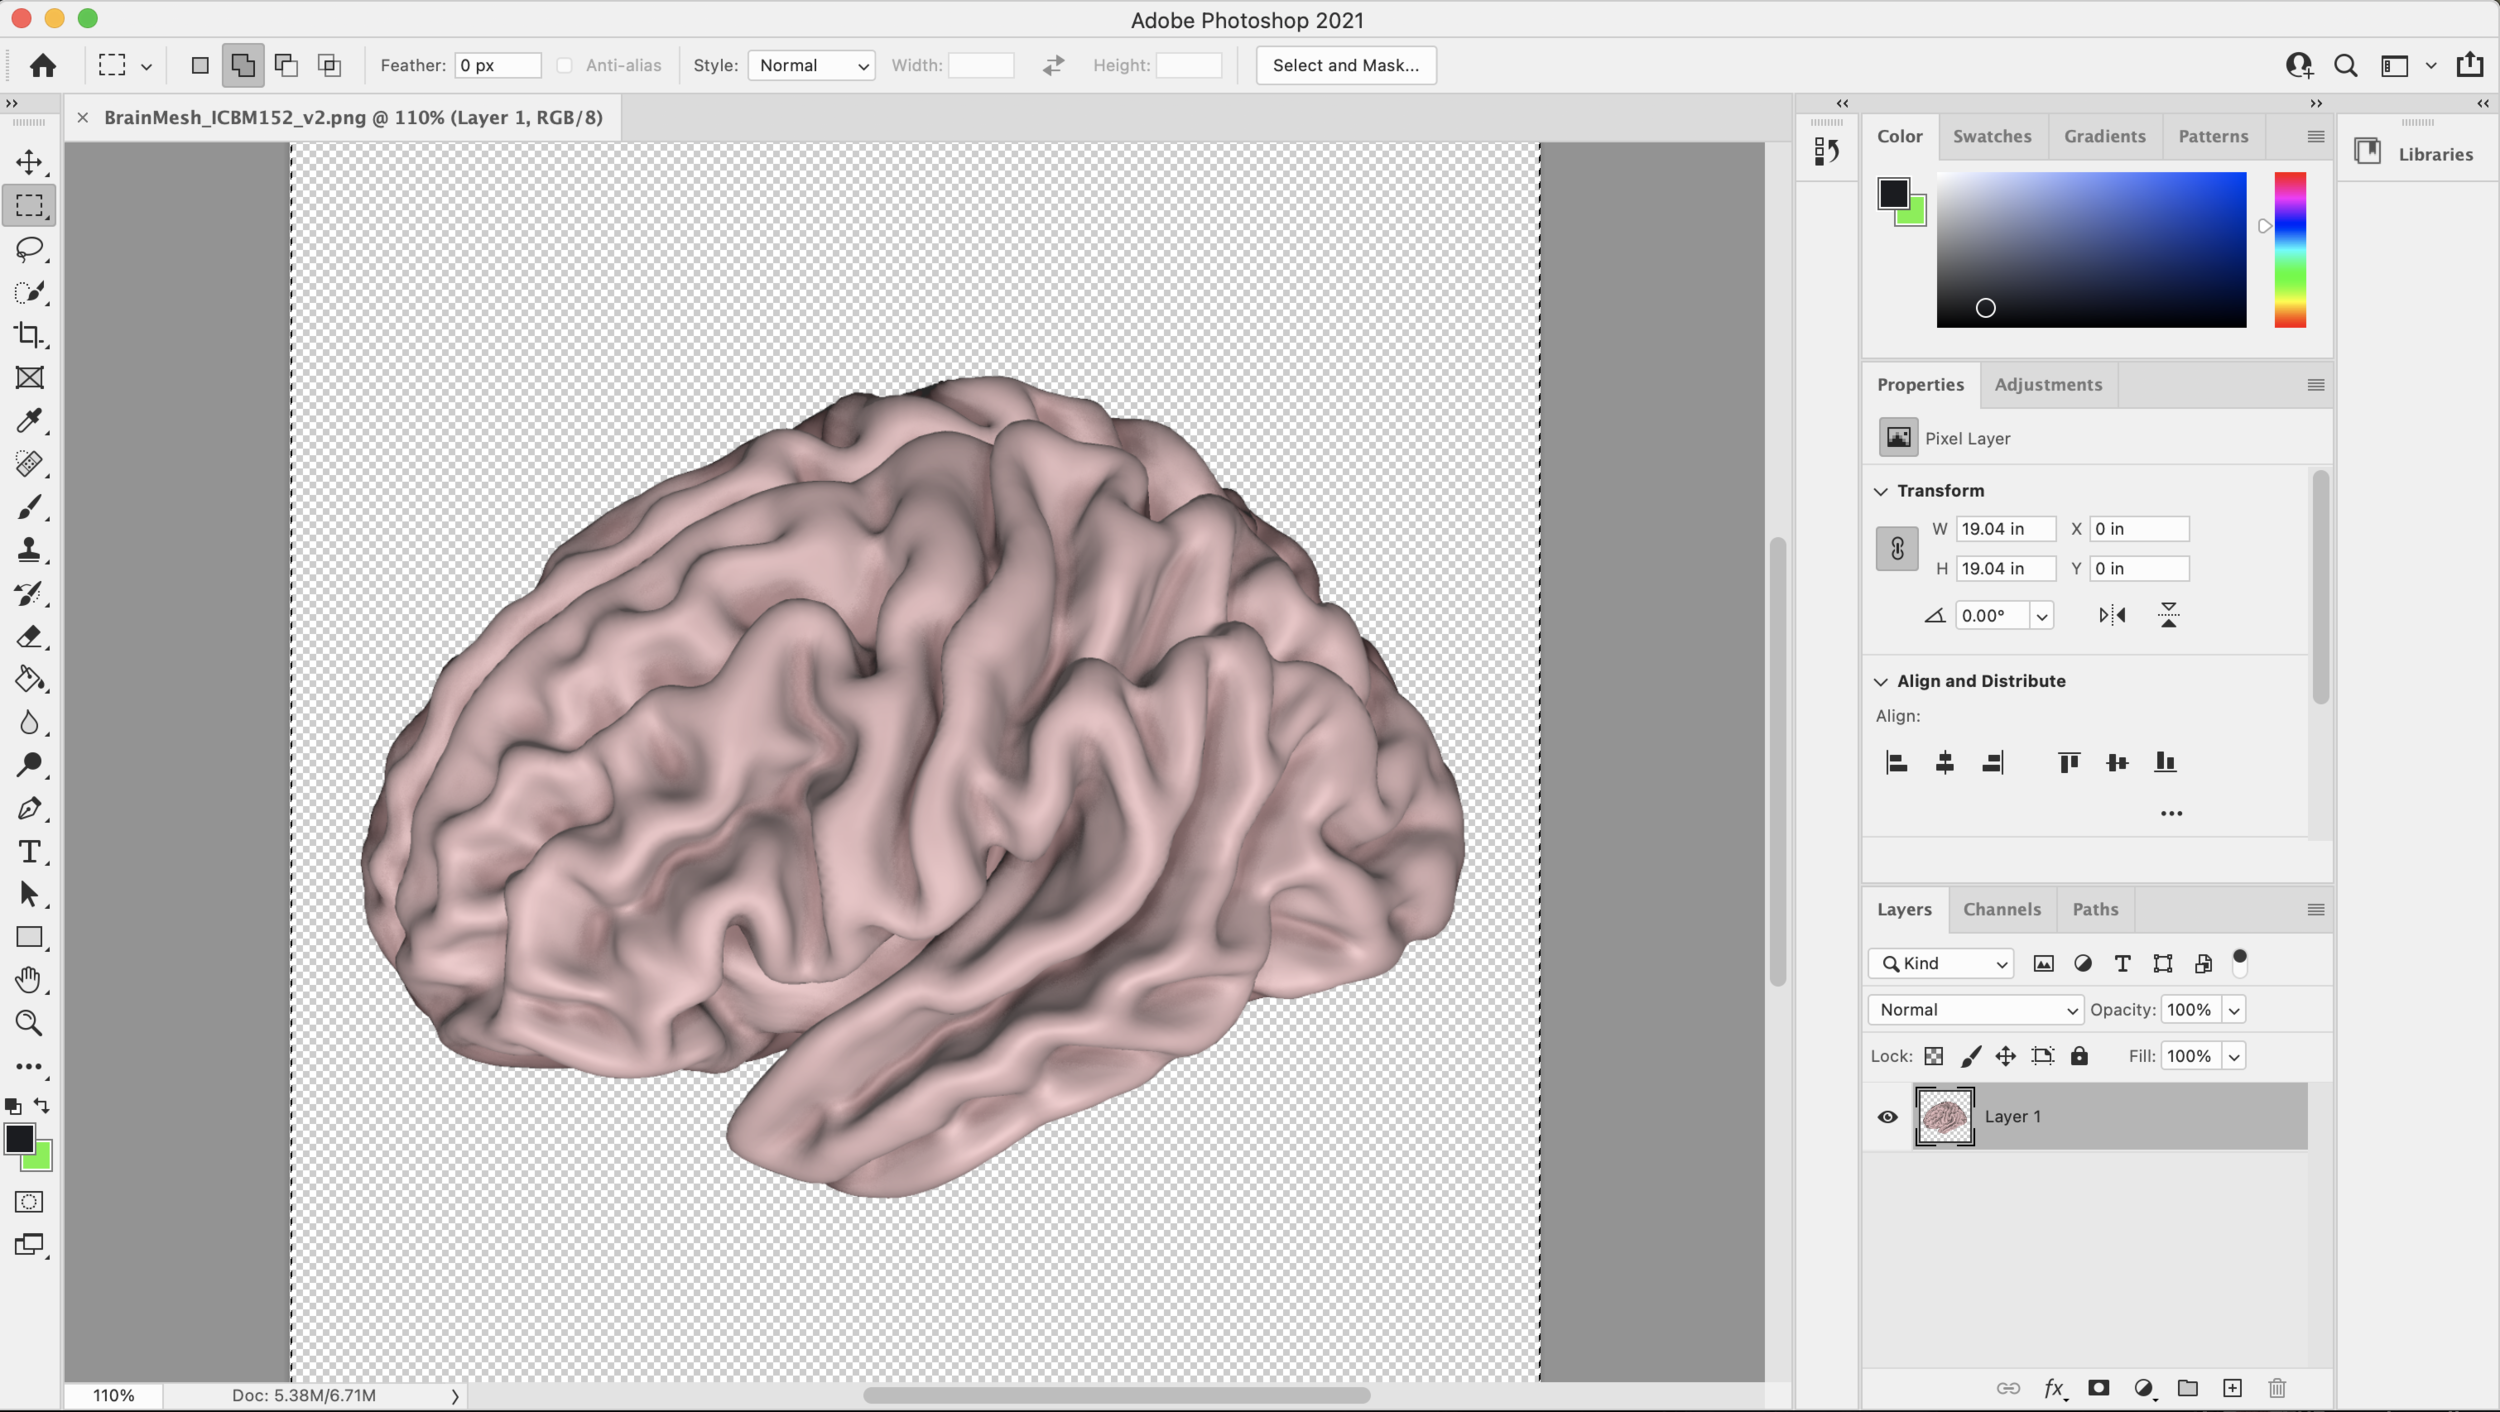
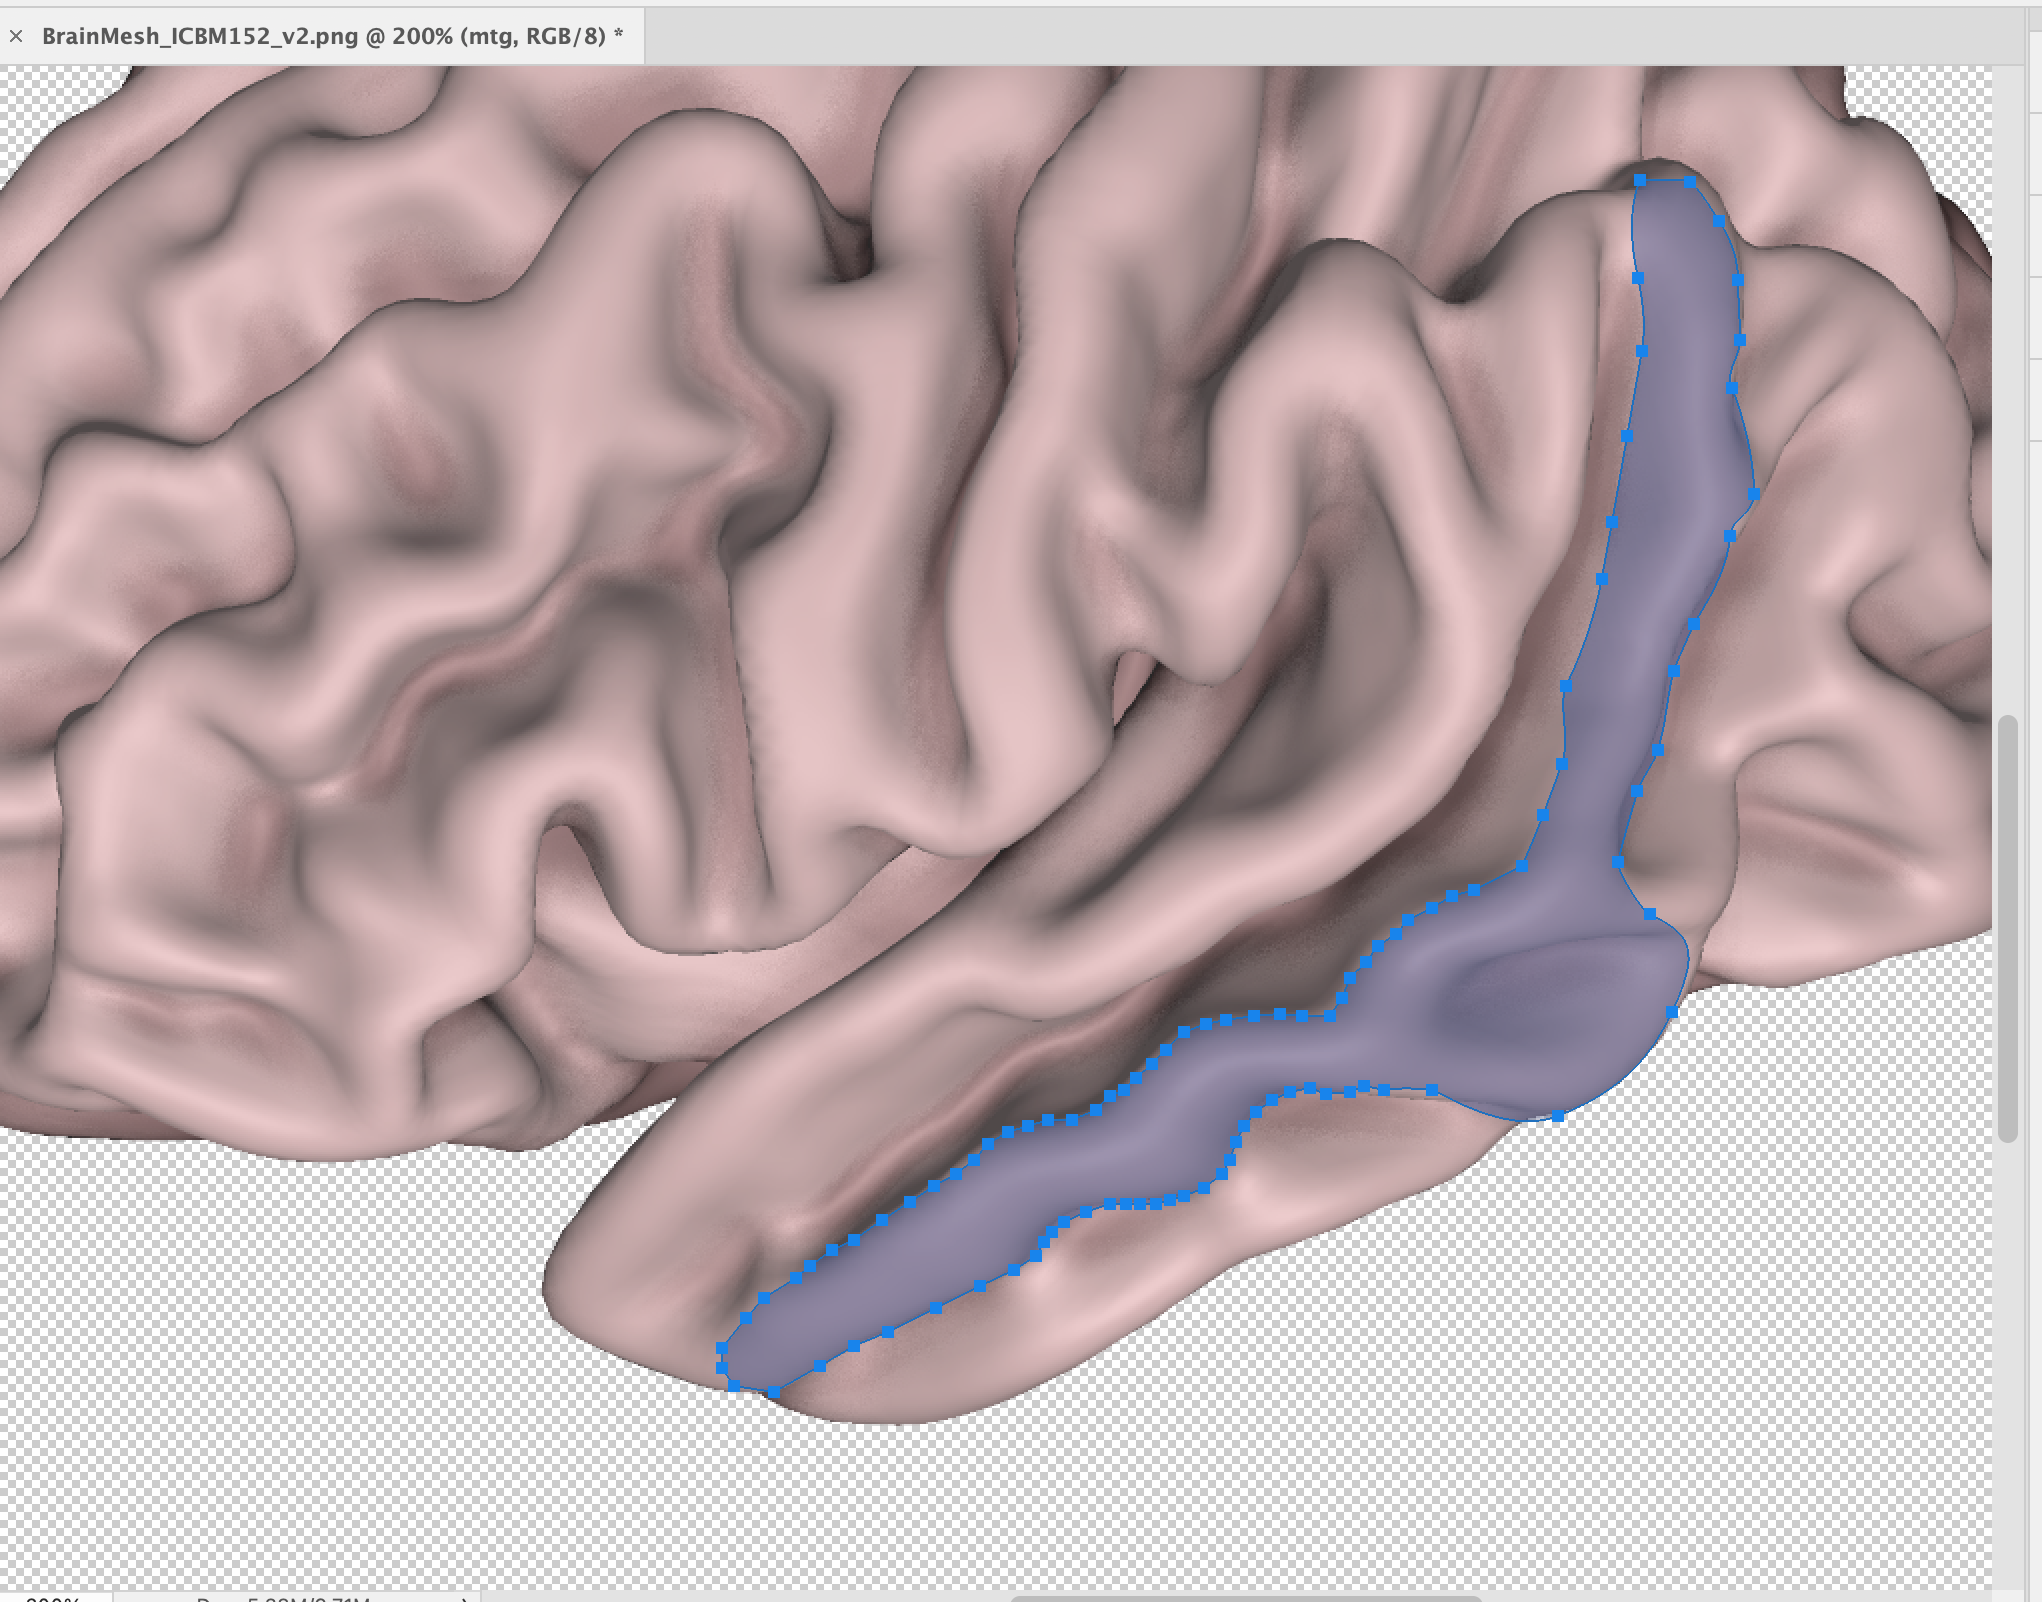
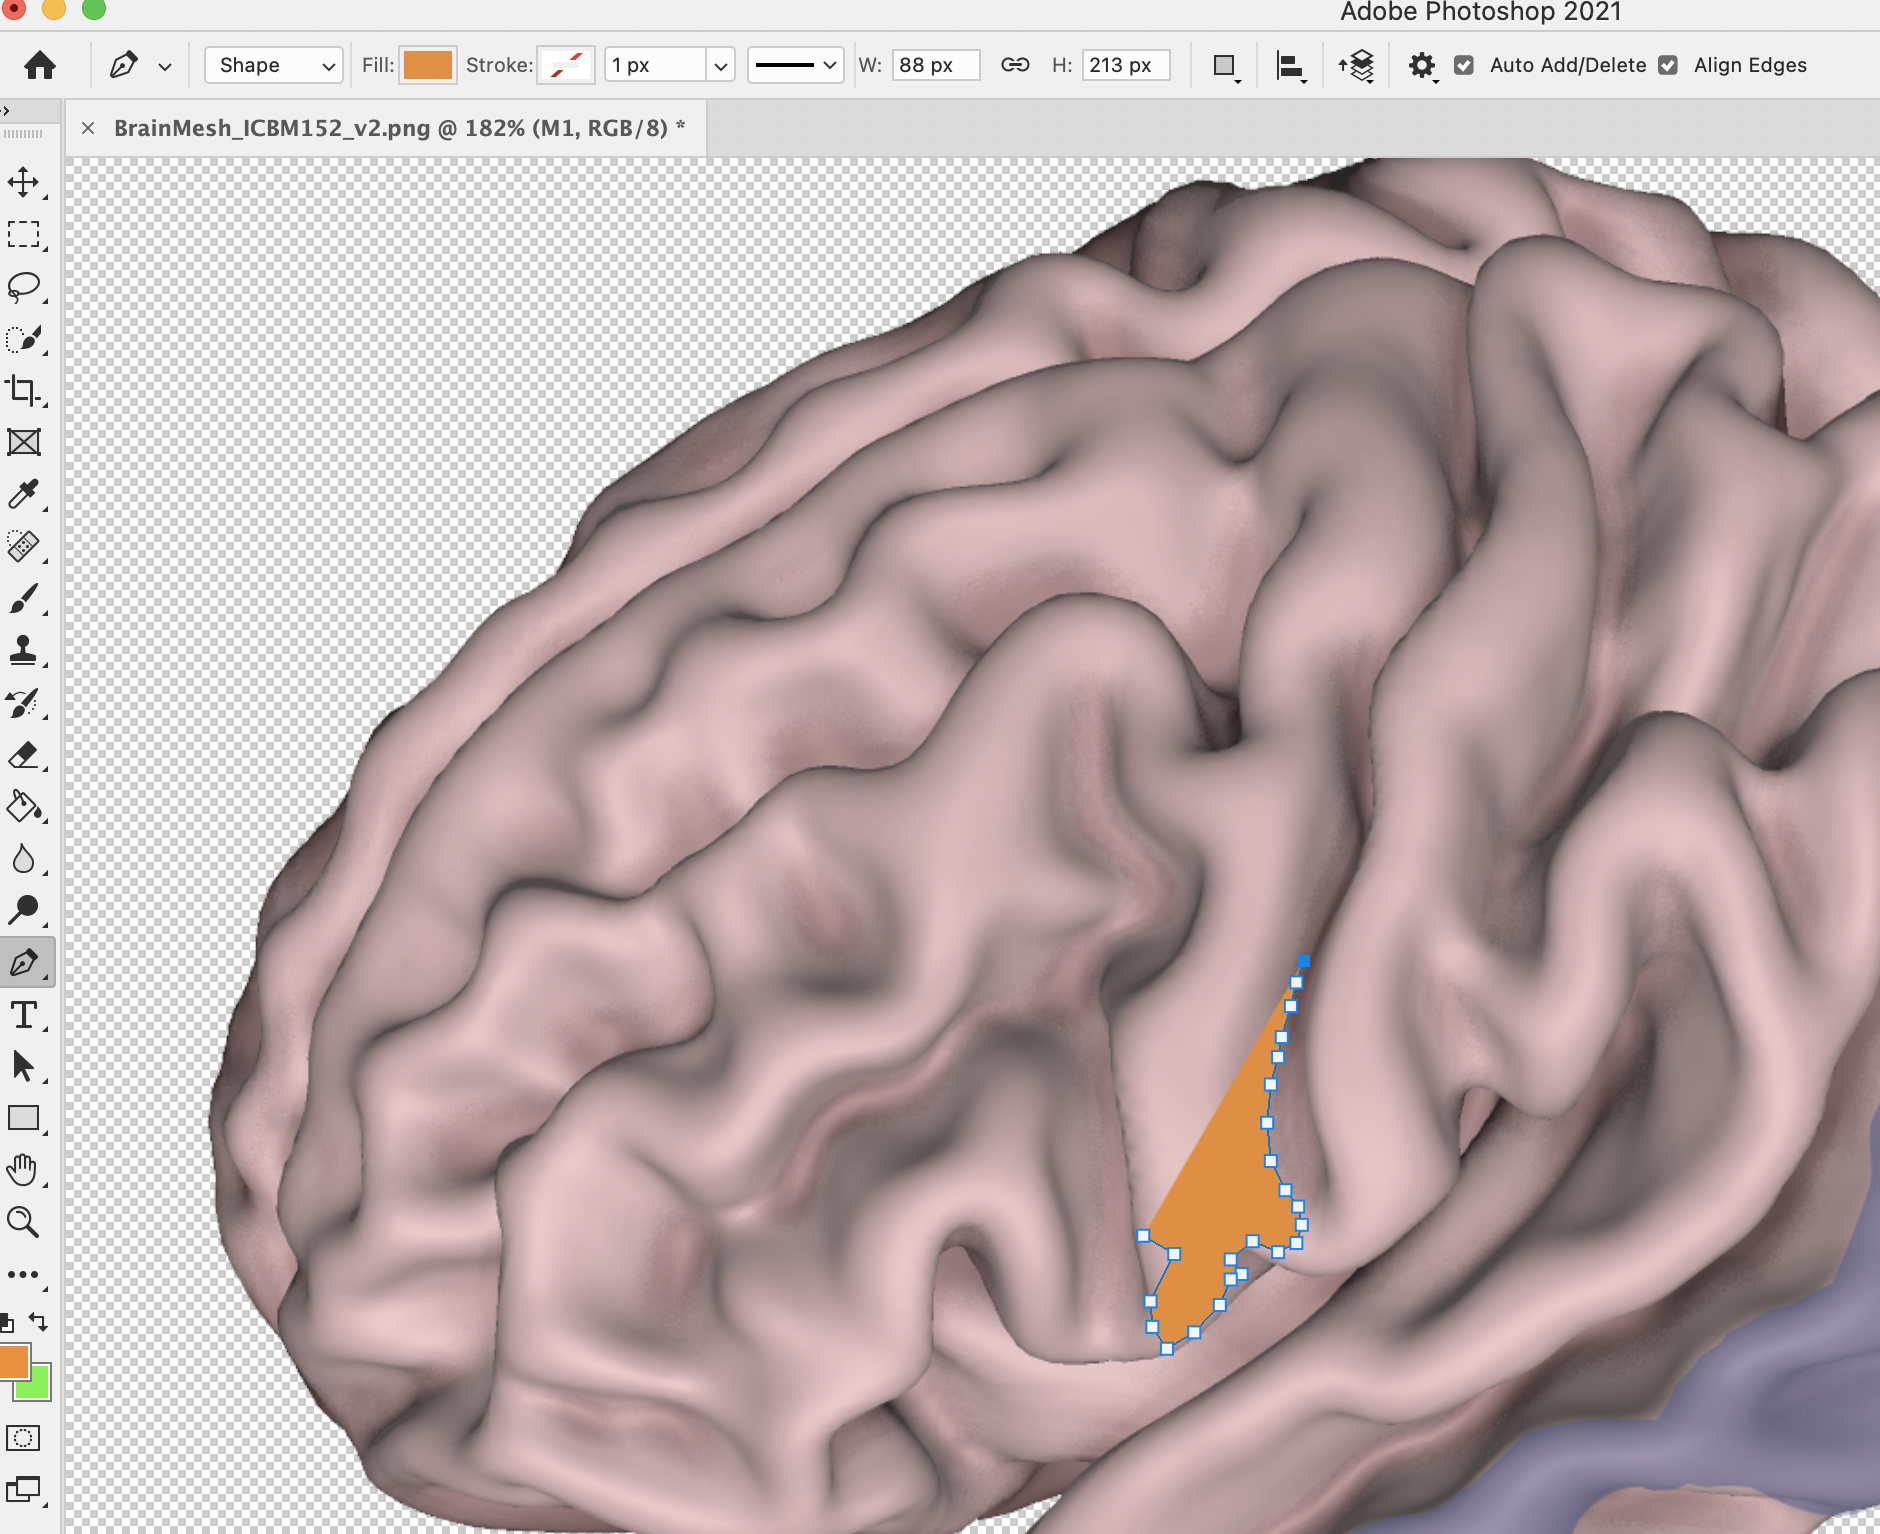
Let’s say we have settled on a left lateral view of BrainMeshICBM152 as our base brain.
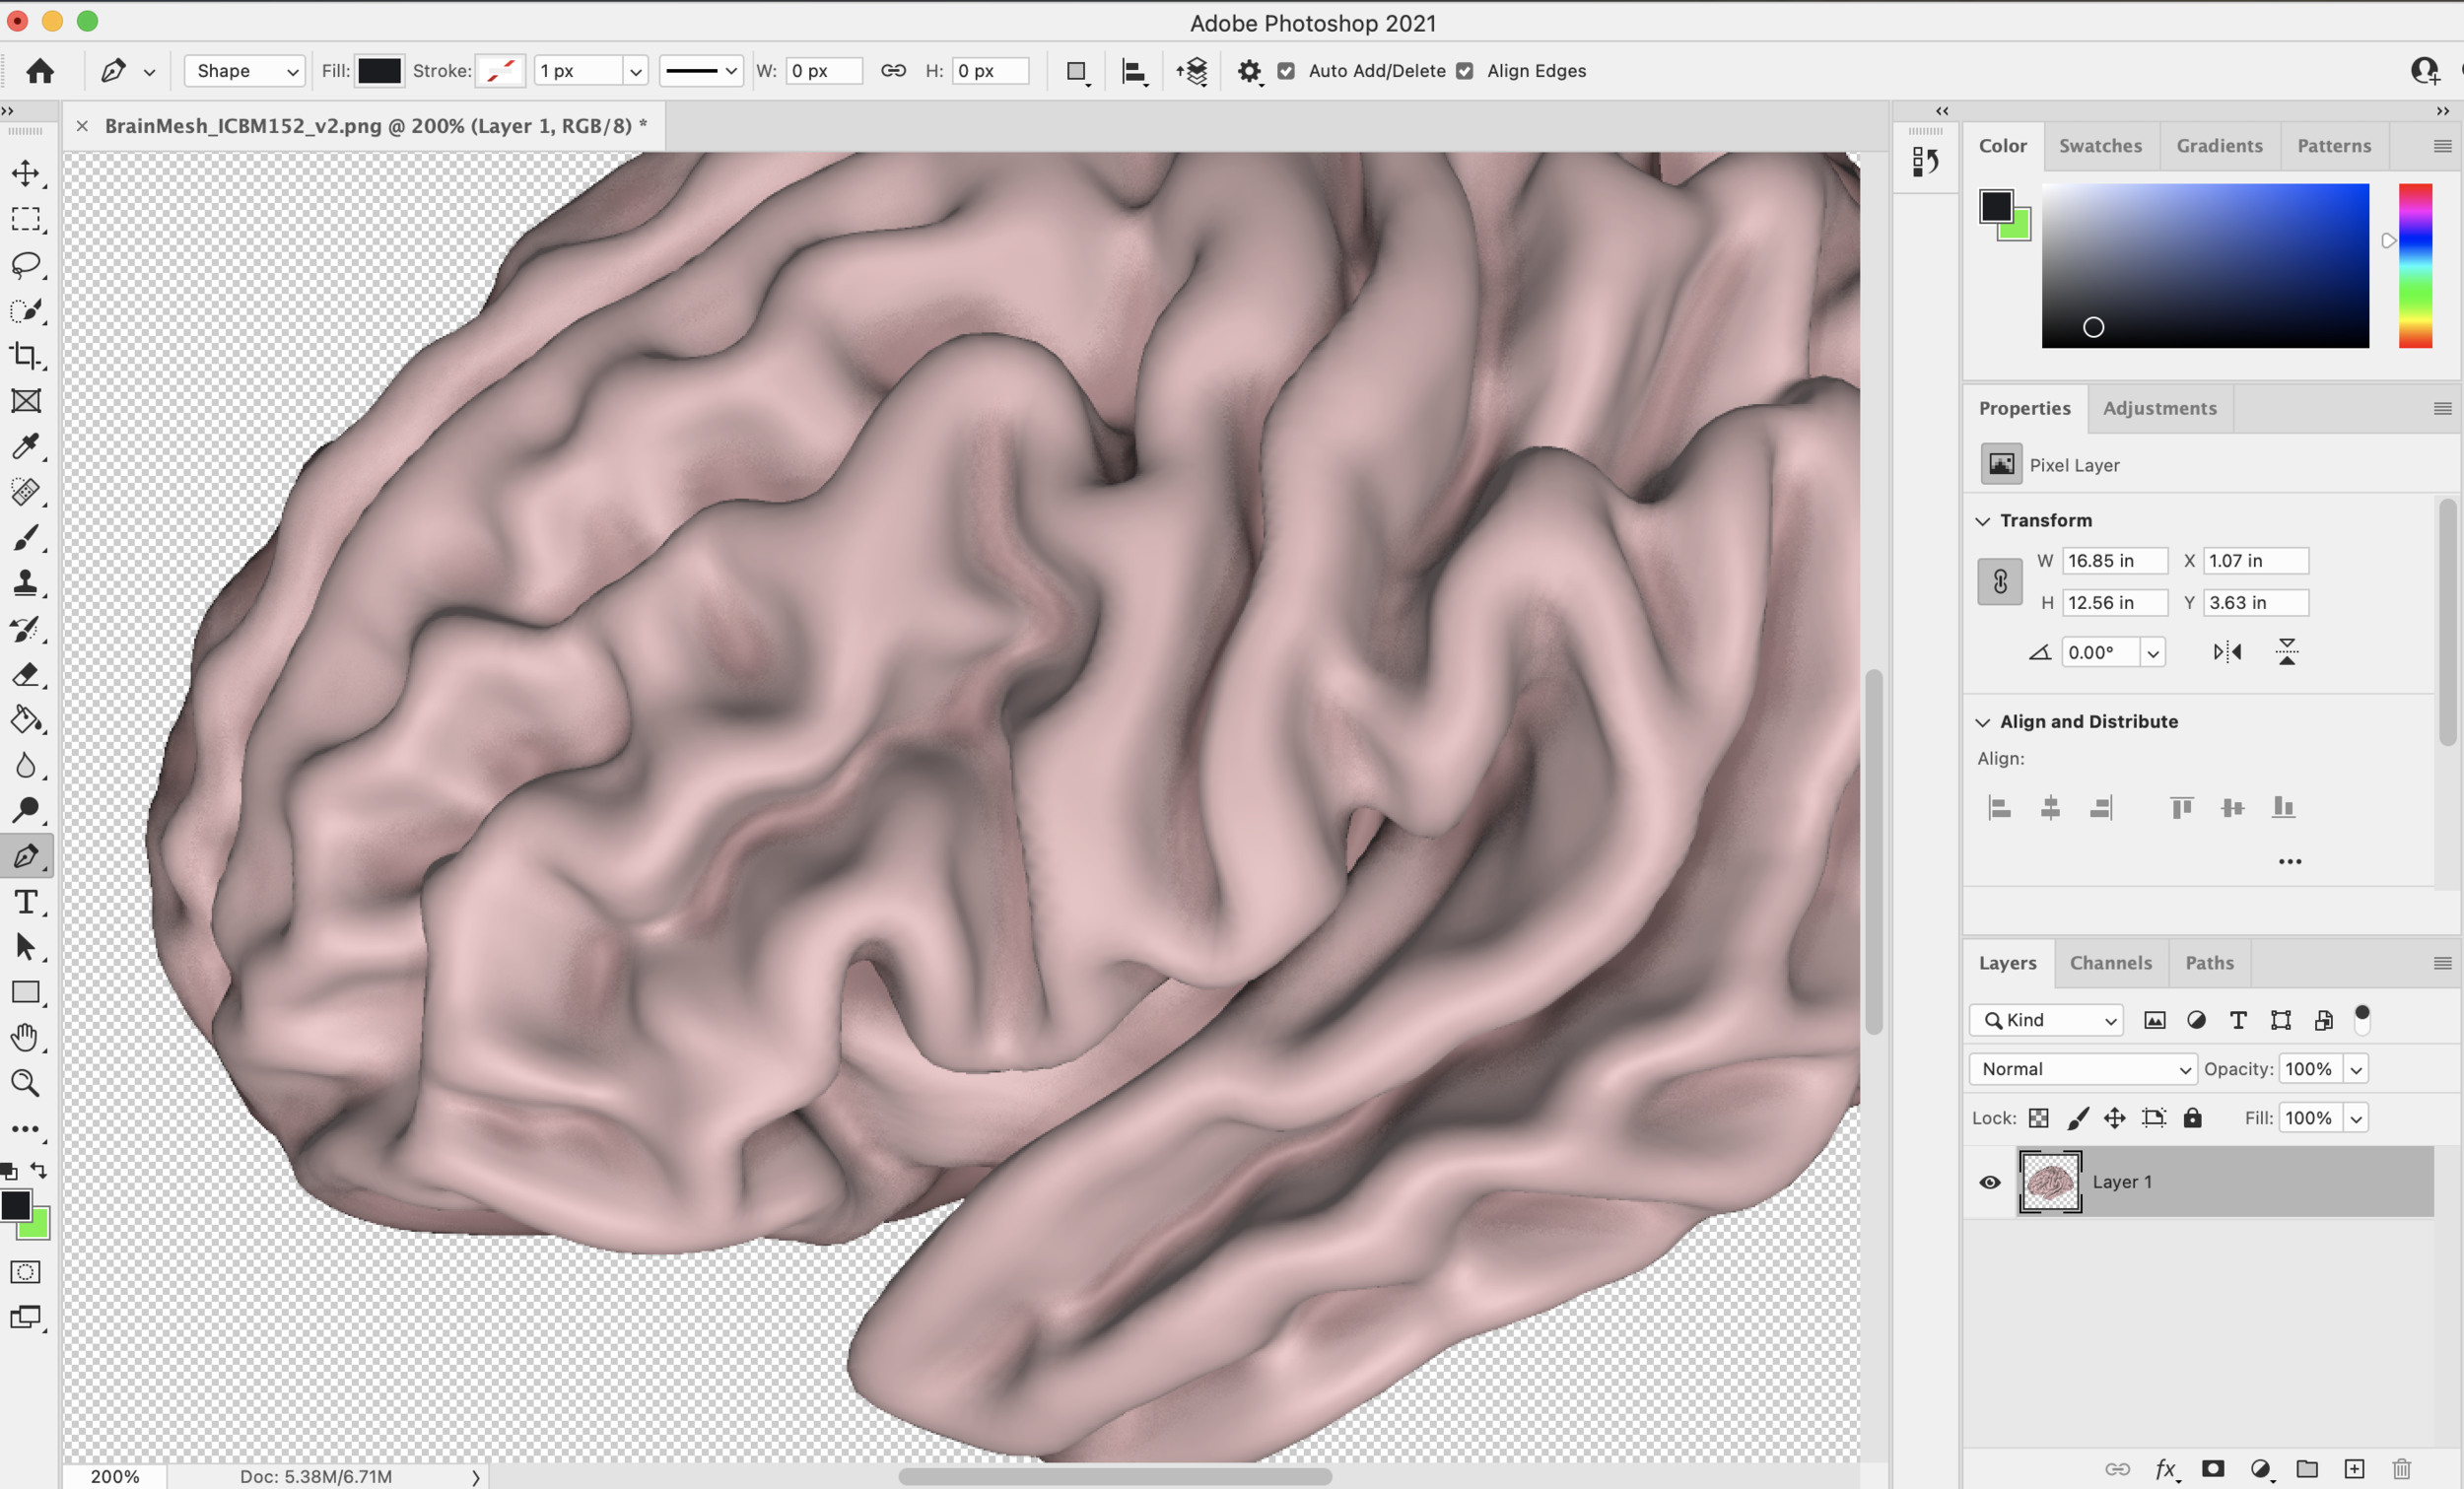
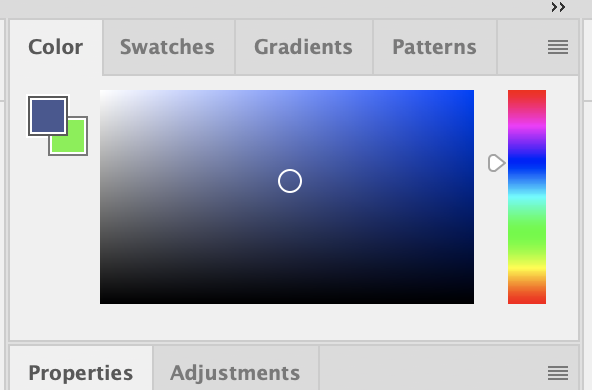
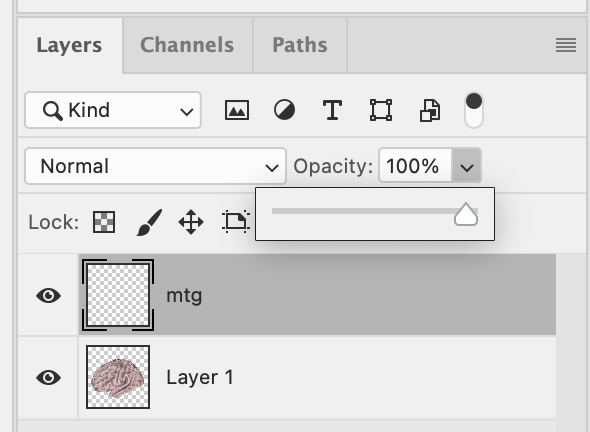
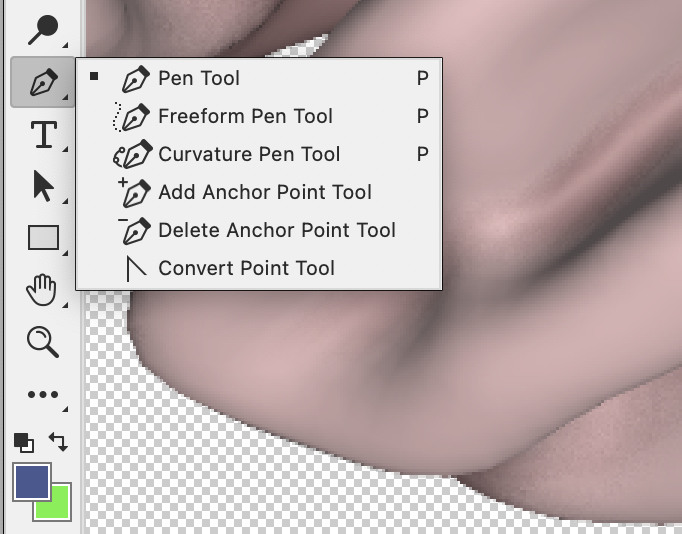
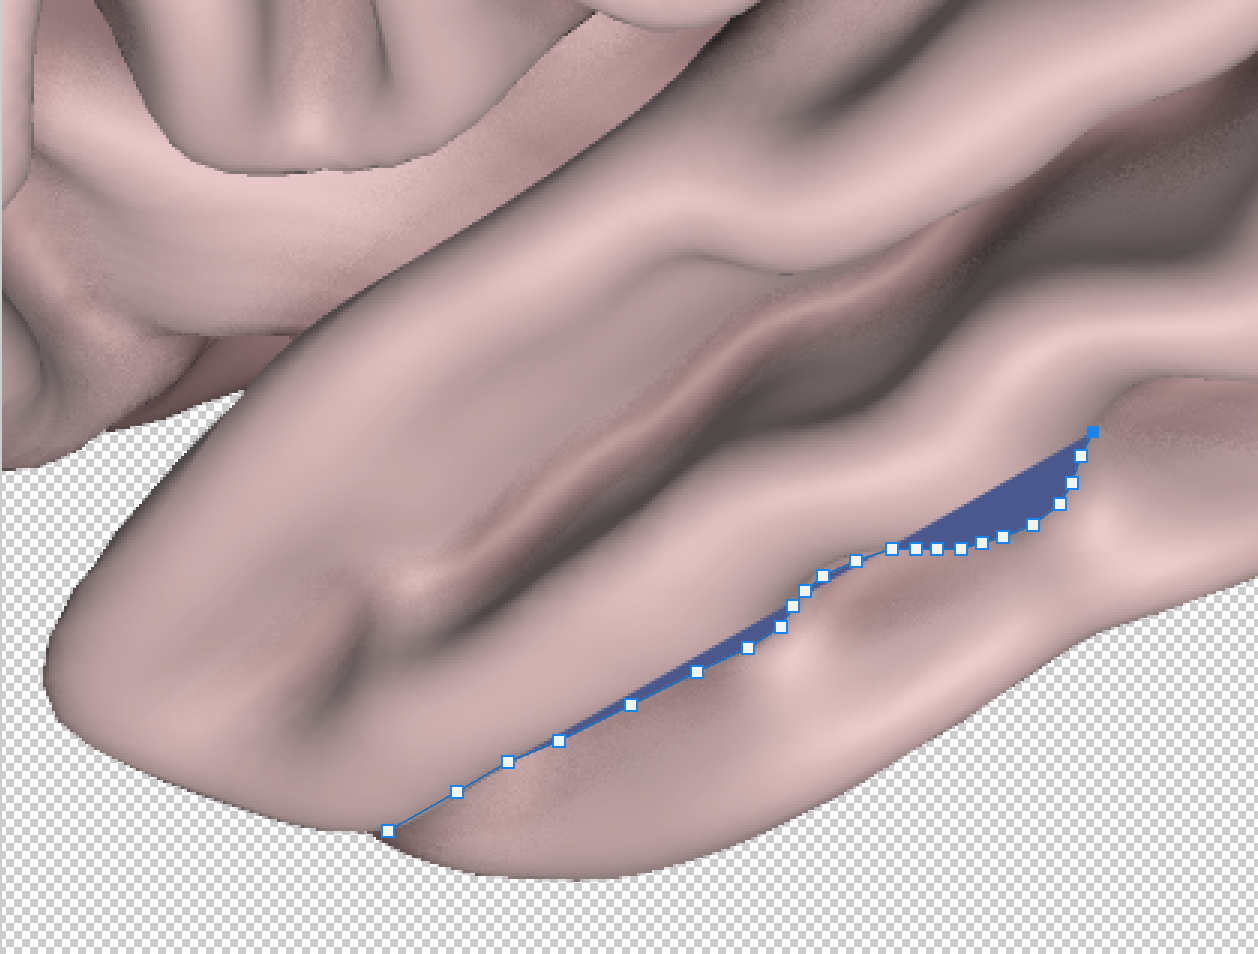
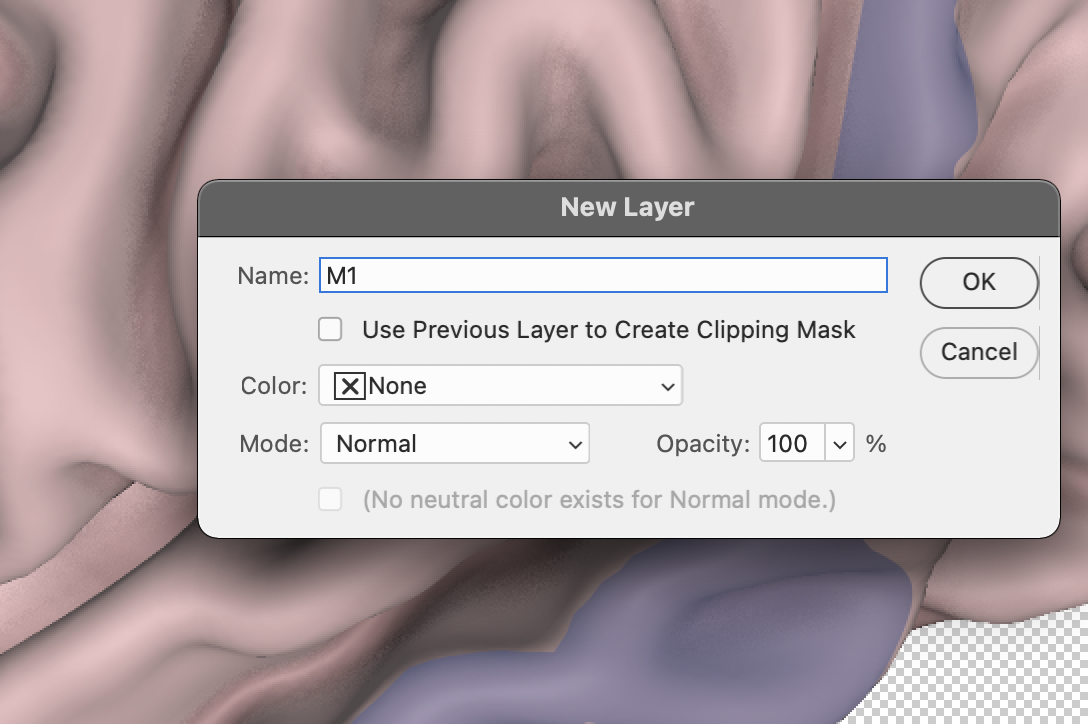
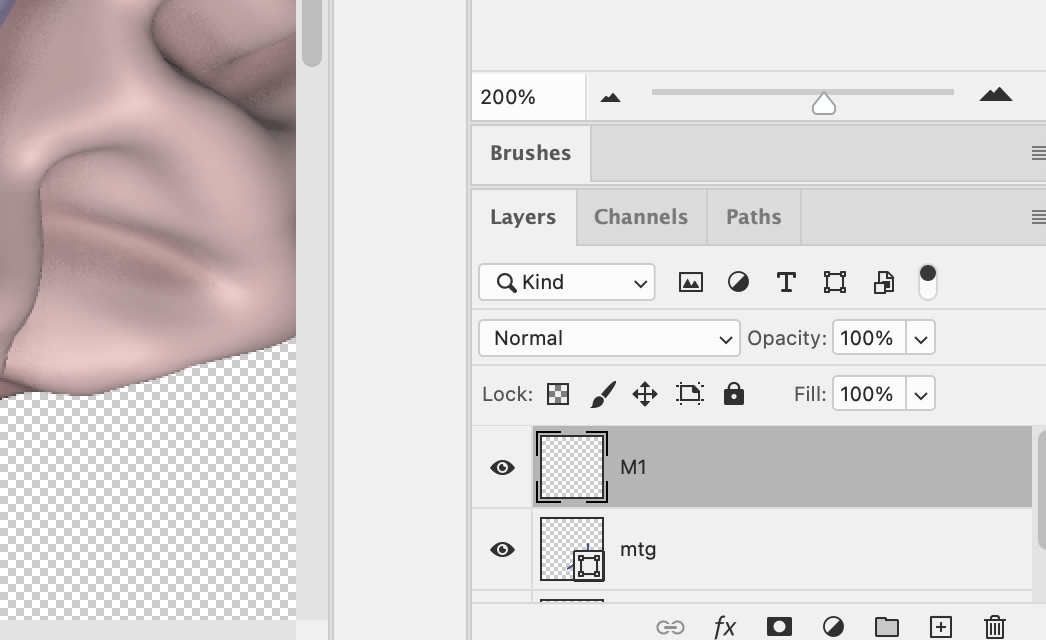
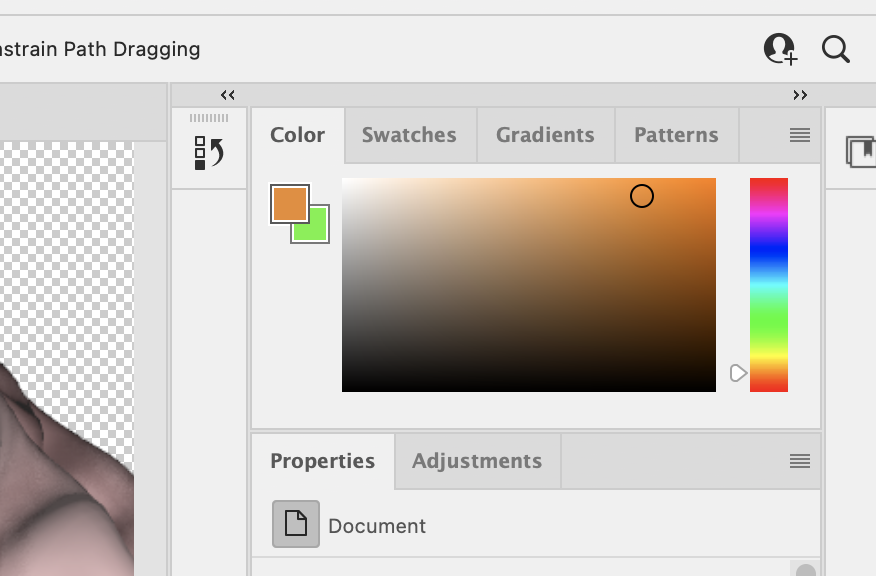
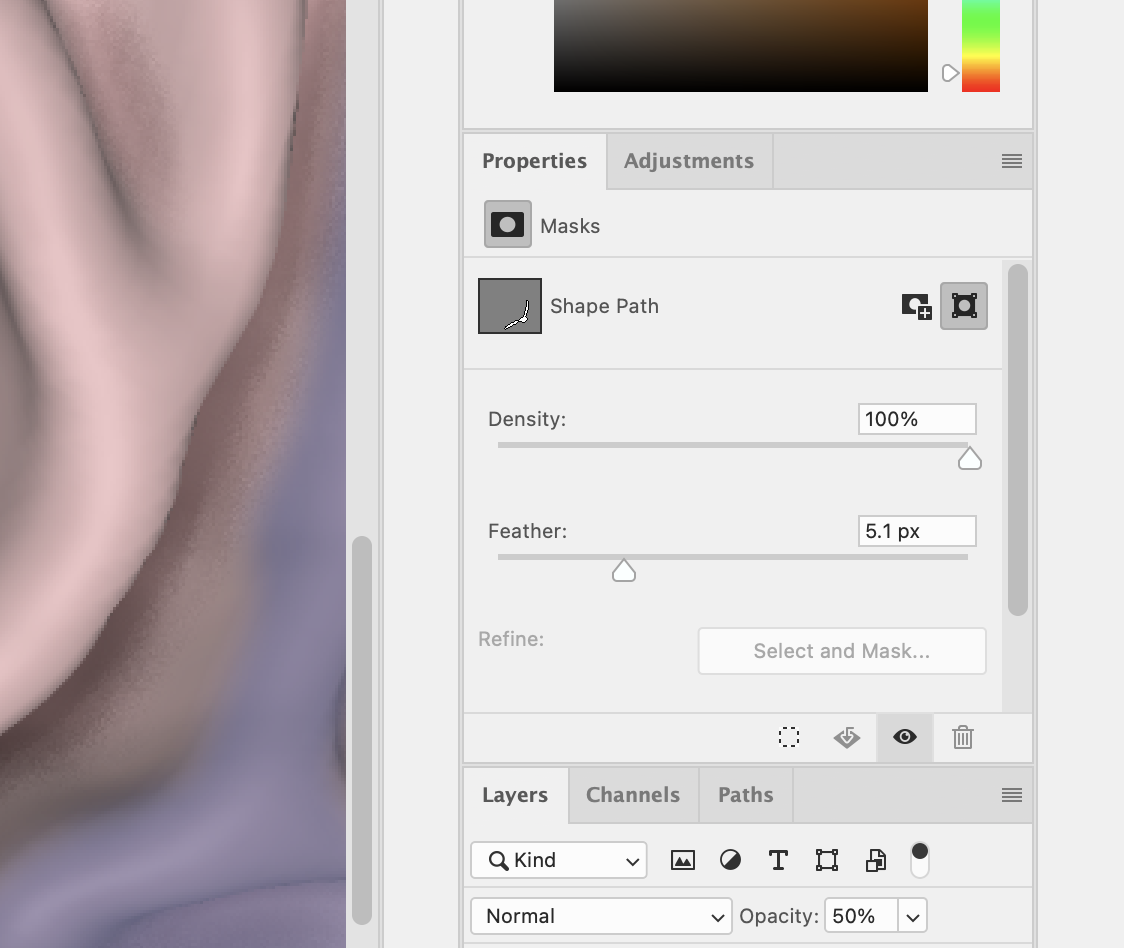
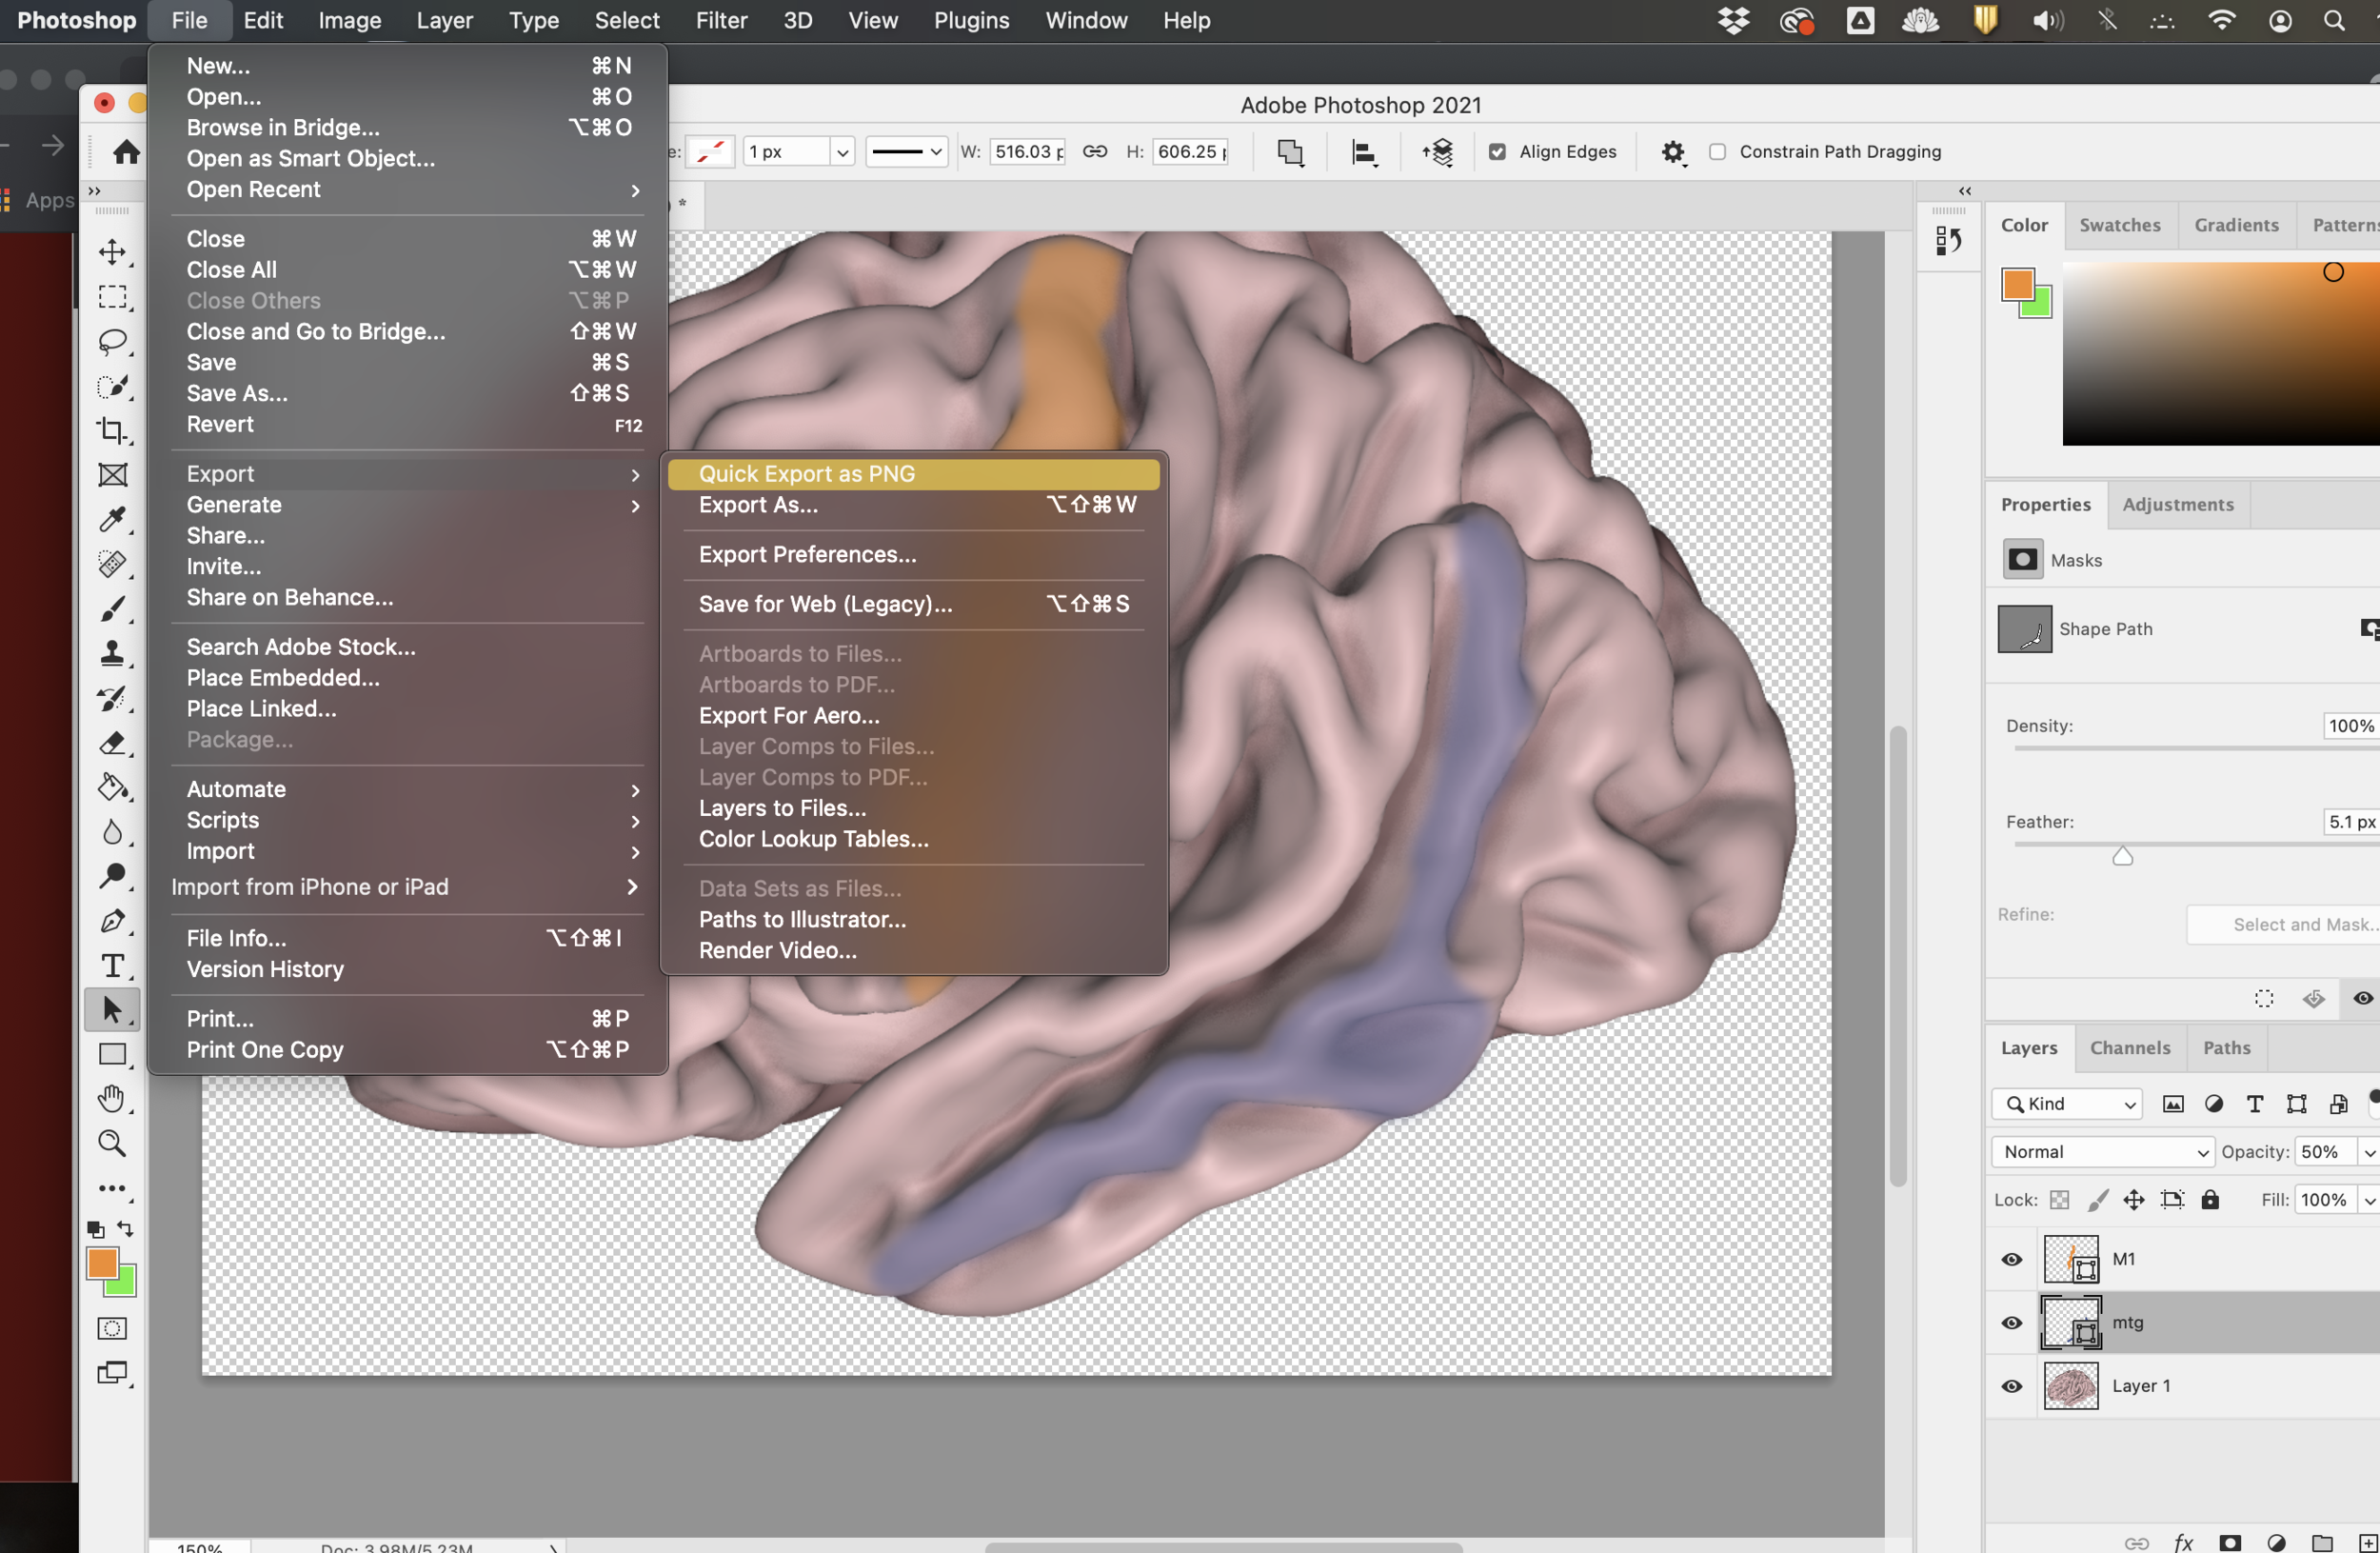
Maybe we want to highlight the precentral gyrus and the middle temporal gyrus. This is getting exciting! You’ll open the brain png file in Adobe Photoshop first. I usually crop the brain square to a 1:1 aspect ratio first (a perfect square). You don’t have to do this step, but squares seem to render pretty well on websites and in presentations. Zoom in on the brain (200%). It is much easier to see gryal/sulcal boundaries when you do this. Our aim is to shade in the MTG and M1. Check an atlas to make sure that you know where these are. I’m going to skip this step and go right into tracing out the two areas. We will go with violet and orange at 60% opacity. A semi-transparent mask allows you to see some tissue underneath the tracing. Drop anchorpoints around the boundaries you want to highlight, and there you have it.

step 3: sit back and revel in your figure
If you need to label this, the best thing to do is port it over to Illustrator.